Databricks Apps is at its best when it’s boring: you deploy an app, wire it to the right Databricks resources, assign permissions via groups, and it just works.
But when it doesn’t work, when the app is slow, unresponsive, or “sort of works for me but not for anyone else”, you need a clear troubleshooting path that starts with configuration basics and ends with evidence (logs + audit + cost/usage).
This post covers:
- What you can (and should) configure for Databricks Apps
- A practical
app.yamlapproach for real deployments - How to configure resources and environment variables safely
- What to do when the app is not responding or performing poorly
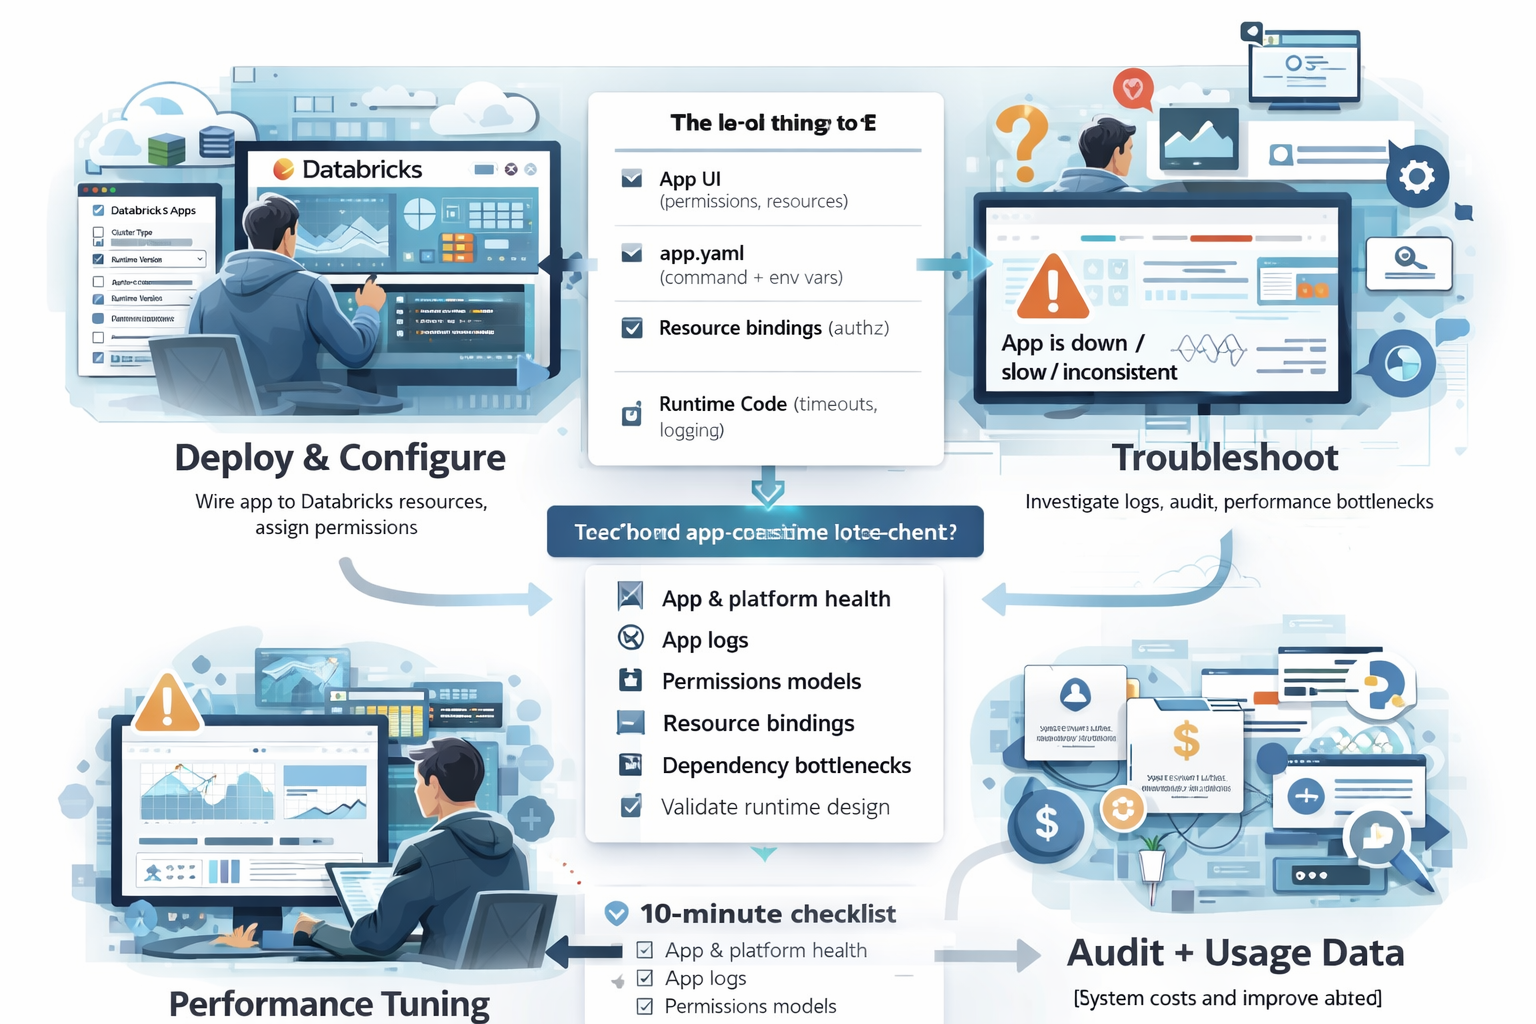
The configuration surface area (what actually matters)
In Databricks Apps, configuration lives in a few places:
- App settings in the Apps UI (permissions, resources, networking, tags, auth model)
app.yamlin the root of your project (command + environment variables)- Resource bindings (SQL warehouses, secrets, model serving endpoints, UC volumes, etc.)
- Your code’s runtime behavior (timeouts, caching, logging, error handling)
The common failure mode is mixing these responsibilities:
- hardcoding resource IDs in code
- embedding secrets in configuration
- relying on local env vars that won’t exist in the app runtime
Keep the contract tight and the app becomes much easier to operate.
app.yaml: the only file I treat as “deployment config”
Databricks Apps supports an optional app.yaml (or .yml) file in your project root to override default runtime behavior.
Two fields matter most:
command: the exact command Databricks runs to start your appenv: environment variables injected into the runtime
Important detail: Databricks does not run command in a shell, so “shell-only” behavior (like FOO=bar cmd) won’t work. If you need parameters, define them in env.
Example app.yaml (Streamlit)
command: ["streamlit", "run", "app.py"]
env:
  - name: LOG_LEVEL
    value: "info"
  - name: WAREHOUSE_ID
    valueFrom: sql-warehouse
  - name: OPENAI_API_KEY
    valueFrom: secret
Rules of thumb:
- Only hardcode values that are static and non-sensitive.
- Never put secrets in
value. UsevalueFromwith a secret resource. - Use
valueFromkeys to keep the app portable across dev/test/prod.
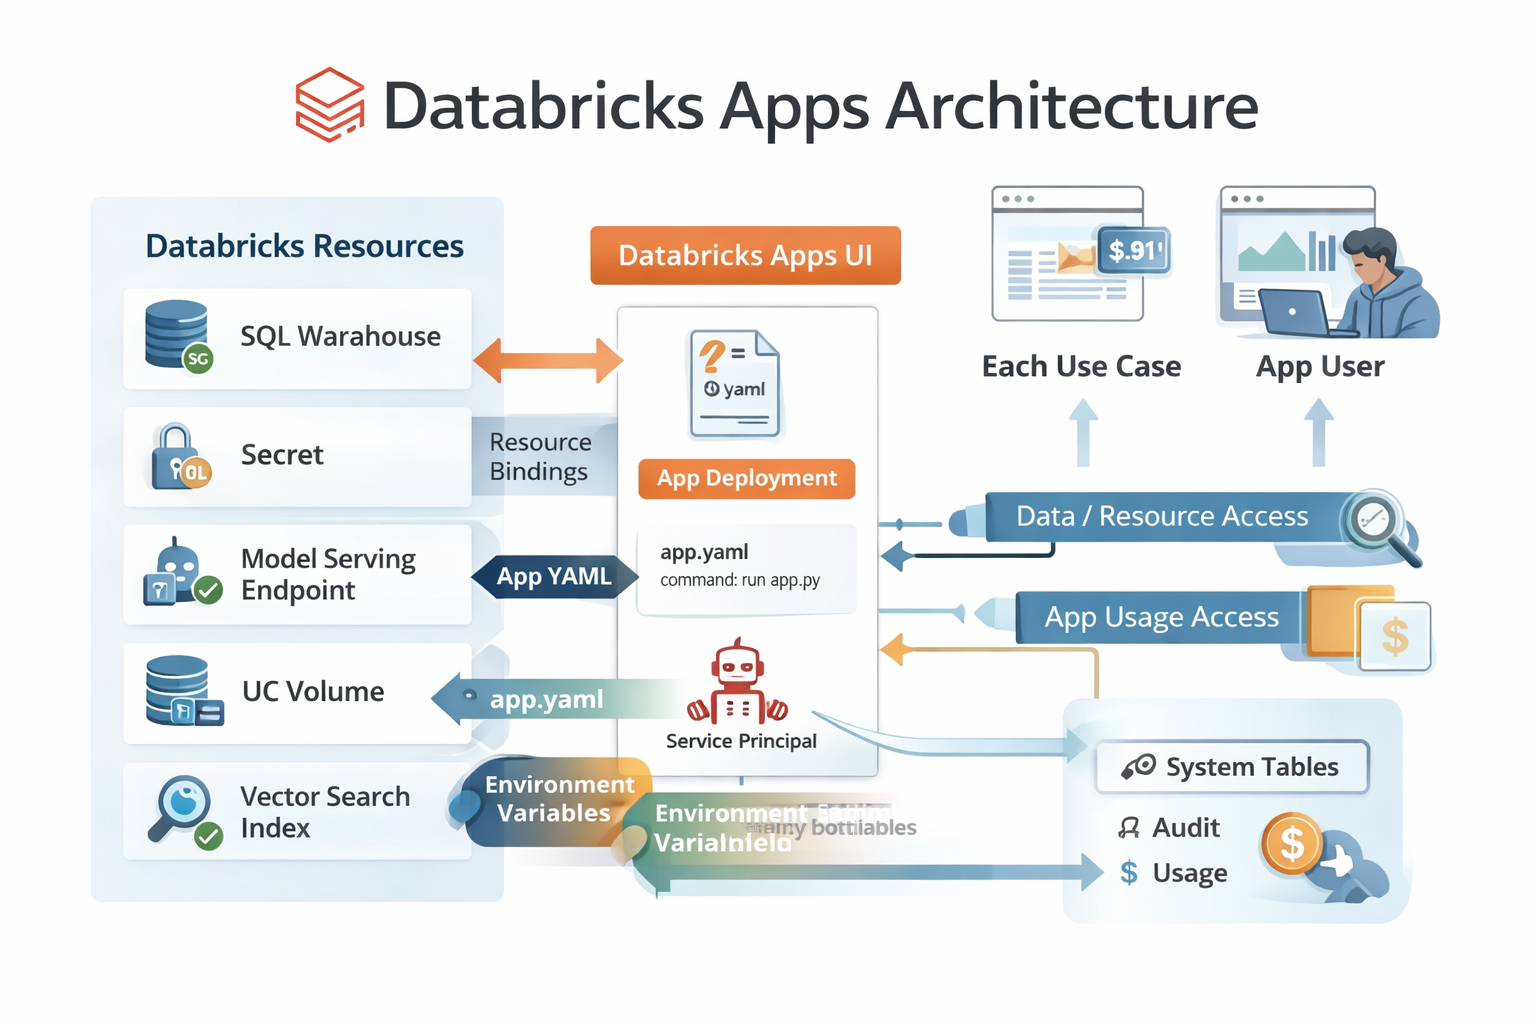
App resources: stop hardcoding warehouses, endpoints, and secrets
Databricks Apps encourages you to attach “resources” to an app (in the Apps UI), such as:
- SQL warehouse
- secret
- model serving endpoint
- Unity Catalog volume
- vector search index
- Lakeflow job
Why this matters:
- You avoid hardcoded IDs in source code.
- The app’s service principal can be granted only the permissions it needs (least privilege).
- Moving the app between environments becomes mostly configuration, not code changes.
Two practical rules:
- The resource must exist before you bind it.
- The person binding it must have Can manage permissions on both the app and the resource.
When your app “is not responding”: a 10-minute checklist
When someone says “the app is down,” I try to identify which of these is true:
- The platform is healthy but your code is failing
- Your code is fine but auth/permissions block the request
- The app loads but a dependency is slow or unavailable (warehouse, serving endpoint, external API)
- The app is doing work in the request path that should be async/batched/cached
Here’s the path I follow.
1) Check app health vs app availability
If your app has an Insights tab (beta), check:
- App service health: platform availability
- App availability: whether your app is serving requests
If app service health is down, that’s a platform incident (open a support case). If app service health is fine but app availability is down, treat it as a deployment/code/config issue.
2) Check application logs (first place to look)
Databricks Apps logs are only available if your app writes to stdout/stderr.
Two ways to view logs:
- In the Apps UI, open the app → Logs
- Append
/logzto the app URL:https://<your-app>.databricksapps.com/logz
Critical operational note: logs are not persisted when app compute shuts down. If you care about production-grade debugging, ship logs out (APM) or write structured logs to a UC volume/table.
3) Validate the “two permission models”
There are two easy-to-confuse checks:
- App permissions: does the user/group have
CAN USE? - Data/resource permissions: does the user (and/or the app service principal) have permission on the UC objects, warehouse, serving endpoint, secret, etc.?
A classic symptom:
- The app loads, but the “data panel” errors out for some users.
That’s almost never “the app is down.” It’s authorization.
4) Confirm resource bindings and keys match valueFrom
If your app.yaml says:
- name: WAREHOUSE_ID
  valueFrom: sql-warehouse
Then the app must have a resource with the key sql-warehouse (or whatever key you set) attached in the Apps UI.
If the key is wrong, the env var will be missing, and you’ll often see confusing “NoneType” errors in code.
5) Look for “dependency bottlenecks” (most performance issues)
If the app is slow but not broken, it’s usually one of these:
- SQL warehouse is cold / queued / undersized
- Model serving endpoint is cold / throttled / timing out
- External API calls are slow (no timeouts, retries, backoff)
- You’re loading too much data into memory per request
What I do:
- Add request-level timing logs around dependency calls
- Set explicit timeouts (never rely on defaults)
- Cache results that don’t need to be real-time
6) Check if you accidentally built a “driver in the request path”
In data apps, it’s easy to do something like:
- run a heavy query
- convert it to pandas
- render a large dataframe
…inside the request/interaction loop. That makes the UI feel frozen.
Fix pattern:
- Keep request work small
- Use pagination/limits
- Pre-aggregate and precompute
- Use async patterns (where your framework supports it)
If the app is performing poorly: what I tune first
1) Reduce round trips to Databricks APIs
Batch queries when possible. Avoid “N queries per dropdown change.”
2) Cache aggressively (but correctly)
Cache:
- reference data (dimensions)
- metadata (lists of tables, schemas)
- the last successful query result for a filter state
Don’t cache:
- user-specific sensitive results across users
- anything that must be strongly consistent
3) Stop moving big data into the UI layer
Use SQL to aggregate down to what the UI needs. Render 200 rows, not 20 million.
4) Use structured logging so you can see latency
Log JSON with:
- user identity (when allowed)
- route/action
- dependency timings (warehouse query time, serving endpoint latency)
- error codes / retries / timeouts
Then ship it to an external log system or persist it to UC.
Operational monitoring: audit + usage tables
If you want to operate apps seriously, use system tables:
system.access.auditfor:- permission changes
- app updates
- user authorization activity
system.billing.usagefor:- app DBU usage and cost attribution (Apps product origin)
These give you answers to questions like:
- “Who granted
CAN MANAGElast night?” - “Which app spiked costs this week?”
- “Are users actually using this thing?”
Final thought
Most Databricks Apps incidents are not “Databricks is down.” They’re configuration mismatches:
- missing resources
- wrong keys
- wrong permissions
- secrets wired incorrectly
- heavy work happening in the request loop
Treat configuration as a first-class artifact (app.yaml + resource bindings + group permissions), invest in logs you can actually keep, and your apps will behave like production software instead of a demo that only works on Tuesdays.
Thank you for reading.
Cheers!
Jason