In my last post, I promised a Spark UI walkthrough you can actually use under pressure. This is that post.
The goal is simple: open the Spark UI (on EMR) and identify whether your job is suffering from:
- Skew (a few tasks do all the work)
- Spill (not enough memory, so Spark spills to disk and gets slow)
- Too many small tasks (scheduler overhead dominates; lots of tiny partitions)
If you follow the steps below, you can usually diagnose the root cause in under 10 minutes.
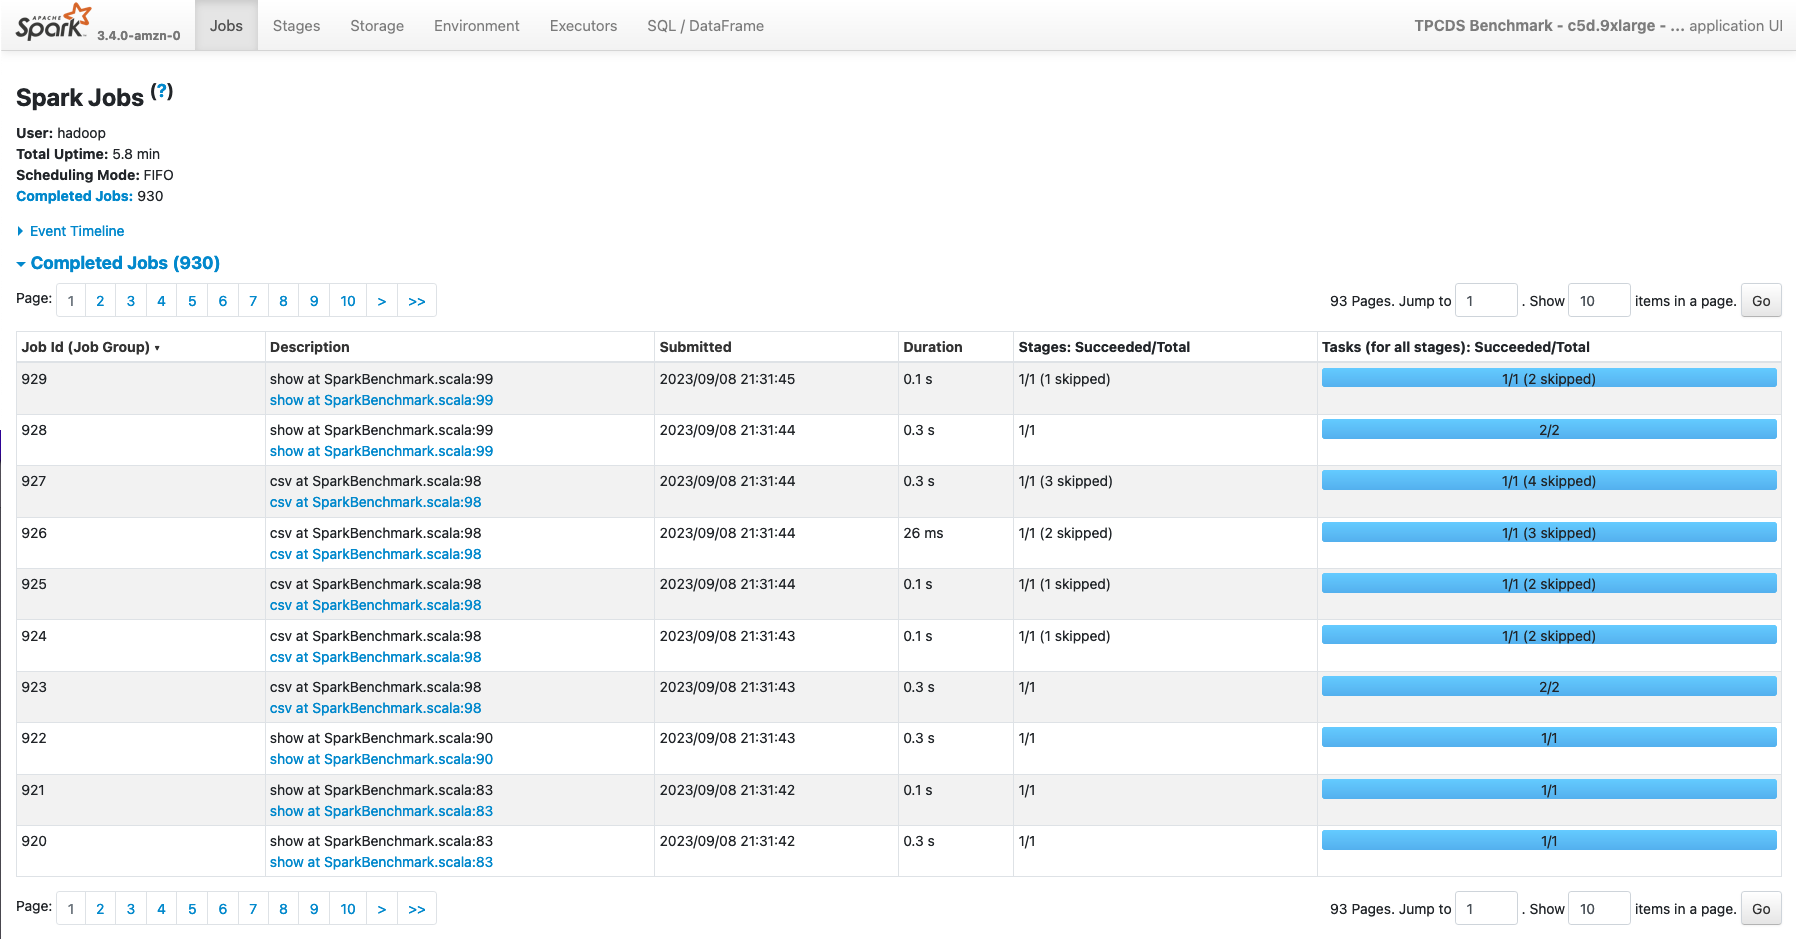
Screenshot (Spark UI on EMR)
How to open Spark UI on EMR (quick)
You typically have two “Spark UIs” on EMR:
- For running apps: the driver UI (often port
4040on the driver host; changes if multiple apps run). - For completed apps: Spark History Server (commonly port
18080on the primary node).
Common access patterns:
- From the EMR console: on newer EMR releases you can open persistent UIs from the cluster UI links.
- Via SSH tunnel (simple and reliable):
ssh -i /path/to/key.pem -N -L 18080:localhost:18080 hadoop@<EMR_PRIMARY_PUBLIC_DNS>
Then open http://localhost:18080 in your browser.
The 10-minute triage flow (what I do every time)
This is the exact order that gives you signal fast.
Minute 0–1: find the bottleneck stage
- Open the application in Spark UI.
- Go to Jobs.
- Click the slowest job (or the job with the biggest wall-clock time).
- Jump to the linked Stages from that job.
What you’re looking for:
- A stage that accounts for most of the runtime.
- A stage with huge shuffle read/write.
- A stage where “some tasks are way slower than others”.
Minute 1–4: diagnose skew (the fastest win)
On the Stages page, click the stage that dominates runtime. Then look for:
- Task time spread: if you see a handful of tasks taking dramatically longer than the median, that’s skew.
- Shuffle read skew: a few tasks reading far more shuffle data than the rest.
- Input records skew: similar pattern, but from input side.
In the stage details, I focus on “summary metrics” style columns (names vary slightly by Spark version):
- Duration / Task Time
- Shuffle Read Size / Records
- Shuffle Write Size
- Input Size / Records
- Spill (Memory/Disk) (if present)
Rule of thumb:
- If (p95) task time is 10x the median, you almost certainly have skew.
Fast fixes (in order):
- Enable AQE + skew join handling (Spark 3.x):
spark.sql.adaptive.enabled=truespark.sql.adaptive.skewJoin.enabled=true
- Broadcast the small side (if it’s truly small and stable).
- Salt the key (when you have extreme “one key owns the world” skew).
- Repartition by the join/agg key before the expensive operation.
Minute 4–7: diagnose spill (memory pressure)
Spill shows up as “everything got slow” during wide stages (joins, groupBy, orderBy, distinct). In the stage details look for:
- Spilled bytes (memory and/or disk spill)
- High shuffle read + high spill (classic “not enough memory for shuffle” signature)
Also check the Executors tab:
- Executors with high GC time
- Executors dying/restarting (OOM, container killed)
- Consistently high memory usage with little headroom
What spill usually means:
- Your partitions are too large, or
- Your executors are too small (memory/overhead), or
- The query plan is creating a massive shuffle (bad join strategy, huge explode, no pre-aggregation)
Fast fixes (in order):
- Fix partition sizing first:
- Increase effective parallelism (more, smaller partitions) before a big shuffle.
- Let AQE coalesce later (so you don’t write millions of tiny files).
- Right-size executors:
- Increase
spark.executor.memoryand/orspark.executor.memoryOverhead.
- Increase
- Reduce shuffle volume:
- Filter early, project fewer columns, pre-aggregate before joins.
Minute 7–9: diagnose “too many small tasks” (scheduler overhead)
This one is sneaky because the cluster looks “busy” but makes slow progress.
Signs:
- Stages with tens/hundreds of thousands of tasks
- Individual tasks are very short (sub-second to a few seconds)
- Total stage time is large anyway because overhead dominates
What it usually means:
- You’re reading tons of small files, or
- You created an extreme number of partitions (often by blindly setting
spark.sql.shuffle.partitionstoo high without AQE), or - A previous step wrote a partition layout that exploded file counts.
Fast fixes:
- Fix small files at the source (compaction): write fewer, larger files (often 128–512 MB is healthy).
- Coalesce before writing (reduce output files) while keeping enough parallelism:
df.coalesce(200).write...
- Use AQE partition coalescing:
spark.sql.adaptive.enabled=truespark.sql.adaptive.coalescePartitions.enabled=true
Minute 9–10: confirm with one “sanity metric”
Before you leave the UI, confirm your diagnosis with one metric:
- Skew: long tail of task times in the bottleneck stage.
- Spill: spilled bytes + high GC + wide stages.
- Too many tasks: task count is massive and median task runtime is tiny.
If you can’t confirm, you don’t have a diagnosis, you have a guess.
The fastest Spark UI pages (and what they’re best at)
- Jobs: which action/job is slow (high-level entry point).
- Stages: the truth (shuffle, skew, spill, task count).
- SQL (if present): which SQL query / operator is blowing up (joins, aggregations).
- Executors: GC time, executor loss/restarts, memory pressure.
- Environment: confirm configs (AQE enabled? shuffle partitions? dynamic allocation?).
What I change first (opinionated defaults)
If you want a small set of defaults that pay off on EMR:
- Turn on AQE and skew join handling (Spark 3.x).
- Start with a sane executor shape (often 4–6 cores per executor) and enough memory to avoid constant spilling.
- Treat small files as a production bug, not a “nice to have”.
- Don’t “fix” performance by randomly turning knobs, use the Spark UI to make one hypothesis at a time.
That’s it for today. In my next post I will discuss how a single skewed join key made a 12 minute job run for 2 hours, and how to fix it without resizing the cluster.
Thank you for reading.
Cheers!
Jason